TITLE: Making a geoJSON powered Leaflet map
DATE: 2018-04-18
AUTHOR: John L. Godlee
====================================================================
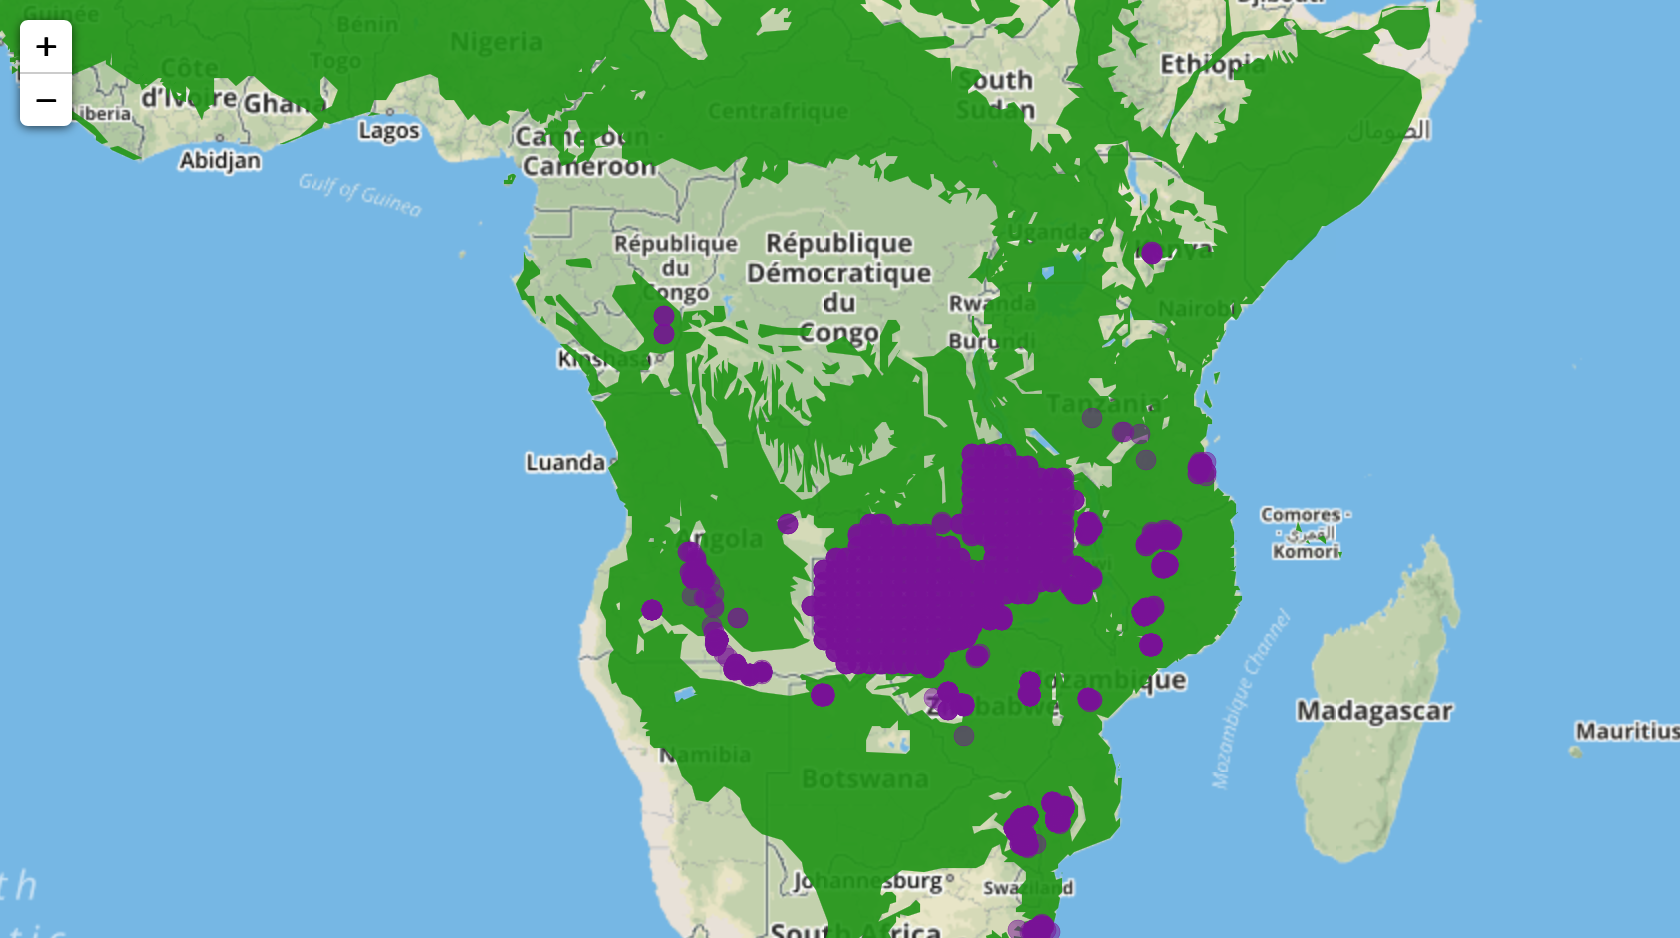
I made a website for my labgroup using Jekyll and Github-pages. It
can be seen here at seosaw.github.io. The bit I want to show off
about is the interactive map I made for the page on data and sites,
which can be seen here.
[seosaw.github.io]: https://seosaw.github.io
[here]: https://seosaw.github.io/data.html
The map is powered using leaflet, which is a Javascript library
specifically for making maps.
[leaflet]: http://leafletjs.com
This is how I got our data to run on the map.
First I have to generate the geoJSON files for the location of our
sites as points, and also for a polygon layer showing the extent of
savannas in Africa. I used R to generate these files because that
is the platform I have the most experience with GIS stuff in. This
is a stripped down version of the script I used to transform the
original data .csv and .shp into geoJSON outputs:
For the plot data:
# Packages ----
library(dplyr)
library(geojsonio)
library(readr)
# Read in plot data
plots <- read.csv("plots.csv")
# Create intermediate data frame ----
plots_export <- plots %>%
filter(!is.na(longitude_of_centre) &
!is.na(latitude_of_centre)) %>%
mutate(name = paste(name, "-", plotcode),
lon =
as.numeric(as.character(longitude_of_centre)),
lat =
as.numeric(as.character(latitude_of_centre)),
area_of_plot = round(as.numeric(area_of_plot)
* 10000, digits = 2)) %>%
select(name, country,
area_of_plot,
lon, lat) %>%
filter(!is.na(lon), !is.na(lat))
# Export to json ----
geojson_write(input = plots_export,
lat = "lat",
lon = "lon",
file = "plots_export")
And for the polygon data:
# Packages ----
library(rgdal)
library(rgeos)
library(geojsonio)
# Read shapefile ----
white_veg <- readOGR(dsn="whitesveg",
layer="Whites vegetation")
# Attempting to transform CRS to wgs84 ----
## No CRS given
proj4string(white_veg)
white_veg <- spTransform(white_veg,
CRS("+proj=longlat +datum=WGS84"))
white_veg_sub <- white_veg[which((white_veg$DESCRIPTIO ==
"Moist-infertile savanna") |
(white_veg$DESCRIPTIO == "Mosaics of forest") |
(white_veg$DESCRIPTIO == "Mopane savanna") |
(white_veg$DESCRIPTIO == "Montane Forest") |
(white_veg$DESCRIPTIO == "Hydropmorphic grassland") |
(white_veg$DESCRIPTIO == "Arid-fertile savanna") |
(white_veg$DESCRIPTIO == "Sedge and reed swamp")),]
white_woodlands_poly <- gUnaryUnion(white_veg_sub)
# Output to geojson ----
# Export to json ----
geojson_write(input = white_woodlands_poly,
file = "miombo_po")
The polygon data comes from White's 1983 vegetation map of Africa,
which remains the best approximation of the biomes of Africa, even
though it was constructed in a very non-systematic fashion.
Next I have to convert these geoJSON files to .js files and name
them as variables by adding a variable designation at the top of
the files like this:
var miombo = [
{"type": "FeatureCollection",
"features": [{
"type": "Feature",
...
var locations = [
{ "type": "Feature", "id": 1, "properties": { "name": "Kruger
Skukuza - SSM-001", "country": "South Africa", "area_of_plot":
40000.0, "lon": 31.4970563, "lat": -25.0197541 }, "geometry": {
"type": "Point", "coordinates": [ 31.4970563, -25.0197541 ] } },
{ "type": "Feature", "id": 2, "properties": { "name":
"Hwange-Farm41 - ZHH-001", "country": "Zimbabwe", "area_of_plot":
1000.0, "lon": 27.90663333, "lat": -18.62653333 }, "geometry": {
"type": "Point", "coordinates": [ 27.90663333, -18.62653333 ] } },
...
Then, I need to construct the javascript file which makes the map,
which calls the map tiles (L.tileLayer), and gives the plot
locations and polygons various aesthetic attributes:
var mymap = L.map('leaf-map').setView([-16.5, 24.7], 4);
L.tileLayer('https://api.tiles.mapbox.com/v4/{id}/{z}/{x}/{y}.png?ac
cess_token=pk.eyJ1IjoibWFwYm94IiwiYSI6ImNpejY4NXVycTA2emYycXBndHRqcm
Z3N3gifQ.rJcFIG214AriISLbB6B5aw', {
maxZoom: 18,
id: 'mapbox.streets'
}).addTo(mymap);
var plotLocOptions = {
fillOpacity: 0.5,
weight: 0.2,
radius: 5,
fillColor: "#7A0099",
color: "#7A0099"
};
function miomboOptions(feature) {
return {
fillOpacity: 0.9,
fillColor: "#179600",
color: "#179600",
weight: 0.1
};
}
L.geoJSON(miombo, {style: miomboOptions}).addTo(mymap);
L.geoJSON(locations, {
pointToLayer: function(feature, latlng) {
return L.circleMarker(latlng, plotLocOptions);
},
onEachFeature: function(feature, layer){
layer.bindPopup("Name: " + feature.properties.name +
"
" +
"Country: " + feature.properties.country + "
" +
"Plot Area: " + feature.properties.area_of_plot + "
m2");
}
}).addTo(mymap);
The only thing left to do is make sure all of these scripts are
called in the right order in the HTML file: